
.png)

Controlling project costs is a critical challenge for architecture and engineering (A/E) firms. To stay on budget, you must identify key financial metrics, monitor them closely, and make data-driven decisions. From utilization rates to profit margins, the following guide will help you understand and manage project costs effectively.
Let’s explore the metrics and strategies essential for staying on budget and delivering projects profitably.
Why Managing Costs Matters
Effective cost management is not just about profitability—it’s about fostering trust with clients, optimizing resource allocation, and building a sustainable business. A well-managed budget ensures that your projects remain financially viable while meeting client expectations.
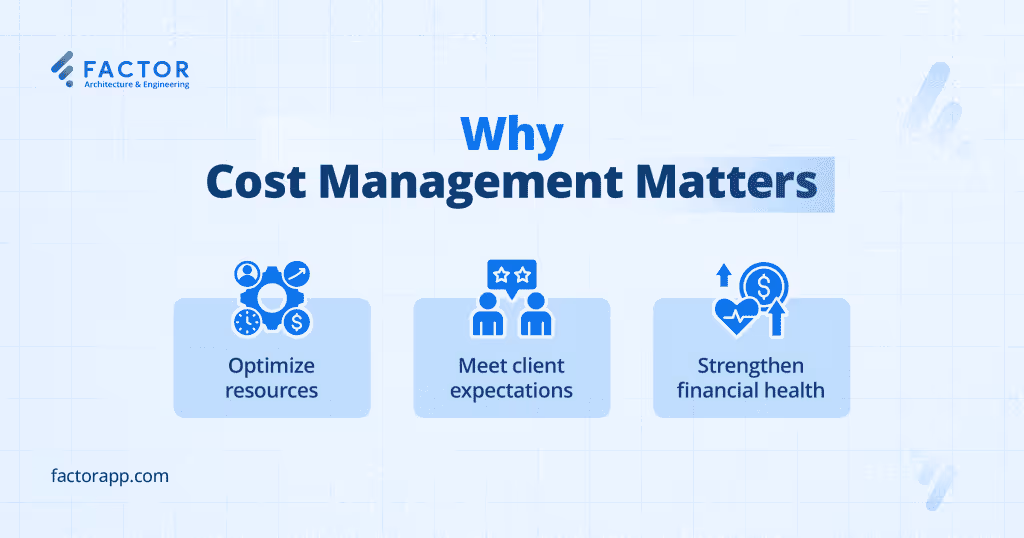
By focusing on key metrics like utilization rates and aged accounts receivable, you can:
- Forecast expenses and revenue with greater accuracy.
- Identify inefficiencies early to prevent cost overruns.
- Strengthen your firm’s overall financial health.
Poor cost management can lead to missed deadlines, strained client relationships, and reduced profitability. Successful firms recognize that a proactive approach to financial management not only ensures project success but also positions the business for long-term growth.
The following metrics serve as a compass, guiding your firm toward profitability while ensuring operational efficiency.
1. Utilization Rate
The utilization rate measures the percentage of billable hours compared to the total hours worked by your team.
A high utilization rate indicates that your staff is working efficiently on billable projects. However, it’s essential to strike a balance—overloading employees can lead to burnout, while a low utilization rate may suggest inefficiencies or underperformance.
How to Calculate:

Ideal Benchmark: For most A/E firms, a utilization rate of 60-65% is a healthy range.
Action Tip: Use smart tools to monitor real-time utilization rates and identify underutilized resources.
2. Overhead Rate
The overhead rate represents the ratio of indirect costs (such as administrative salaries, office rent, and utilities) to direct labor costs.
Understanding overhead rates helps firms manage non-billable expenses and ensures that projects remain profitable.
How to Calculate:

Ideal Benchmark: An overhead rate between 1.5 and 2.0 is typical for most A/E firms.
Action Tip: Regularly review overhead expenses and identify areas where costs can be reduced without impacting productivity.
3. Break-Even Rate
The break-even rate reflects the minimum amount of revenue needed to cover both direct and indirect costs.
This metric highlights the financial baseline your firm must meet to avoid losses. Knowing your break-even rate ensures accurate pricing for projects and prevents underestimating costs.
How to Calculate:

Ideal Benchmark: Firms should aim for a break-even rate of approximately 2.5.
Action Tip: Use break-even analysis during project planning to ensure fees align with profitability goals.
4. Net Multiplier
The net multiplier measures the revenue generated for every dollar spent on direct labor.
This metric is a direct indicator of profitability. A high net multiplier means your firm is effectively turning labor into revenue, while a low multiplier suggests inefficiencies.
How to Calculate:

Ideal Benchmark: A net multiplier of 3.0 or higher is generally considered strong.
Action Tip: Monitor your net multiplier for each project to identify trends and address potential issues early.
5. Aged Accounts Receivable (A/R)
Aged accounts receivable tracks how long it takes for clients to pay invoices after they are issued.
Late payments can disrupt cash flow, leading to operational challenges. A high-age A/R indicates that your firm may need to tighten its invoicing and payment follow-up processes.
How to Calculate:

Ideal Benchmark: Aim to keep aged accounts receivable under 15%.
Action Tip: Use automated invoicing systems to send reminders and reduce payment delays.
6. Profit-to-Earnings Ratio (P/E)
The profit-to-earnings ratio measures your firm’s profitability by comparing net income to total earnings.
This metric reveals how efficiently your firm is converting revenue into profit. It’s an essential measure of overall financial health.
How to Calculate:

Ideal Benchmark: Most A/E firms should aim for a P/E ratio of 15-20%.
Action Tip: Analyze P/E ratios regularly and compare them with industry benchmarks to identify areas for improvement.
7. Net Revenue Per Employee
Net revenue per employee evaluates how much revenue is generated on average by each team member.
This metric reflects productivity and helps gauge whether your staffing levels align with workload demands.
How to Calculate:

Ideal Benchmark: A/E firms often target $150,000 to $200,000 in net revenue per employee annually.
Action Tip: Monitor this metric to balance staffing levels and ensure optimal team performance.

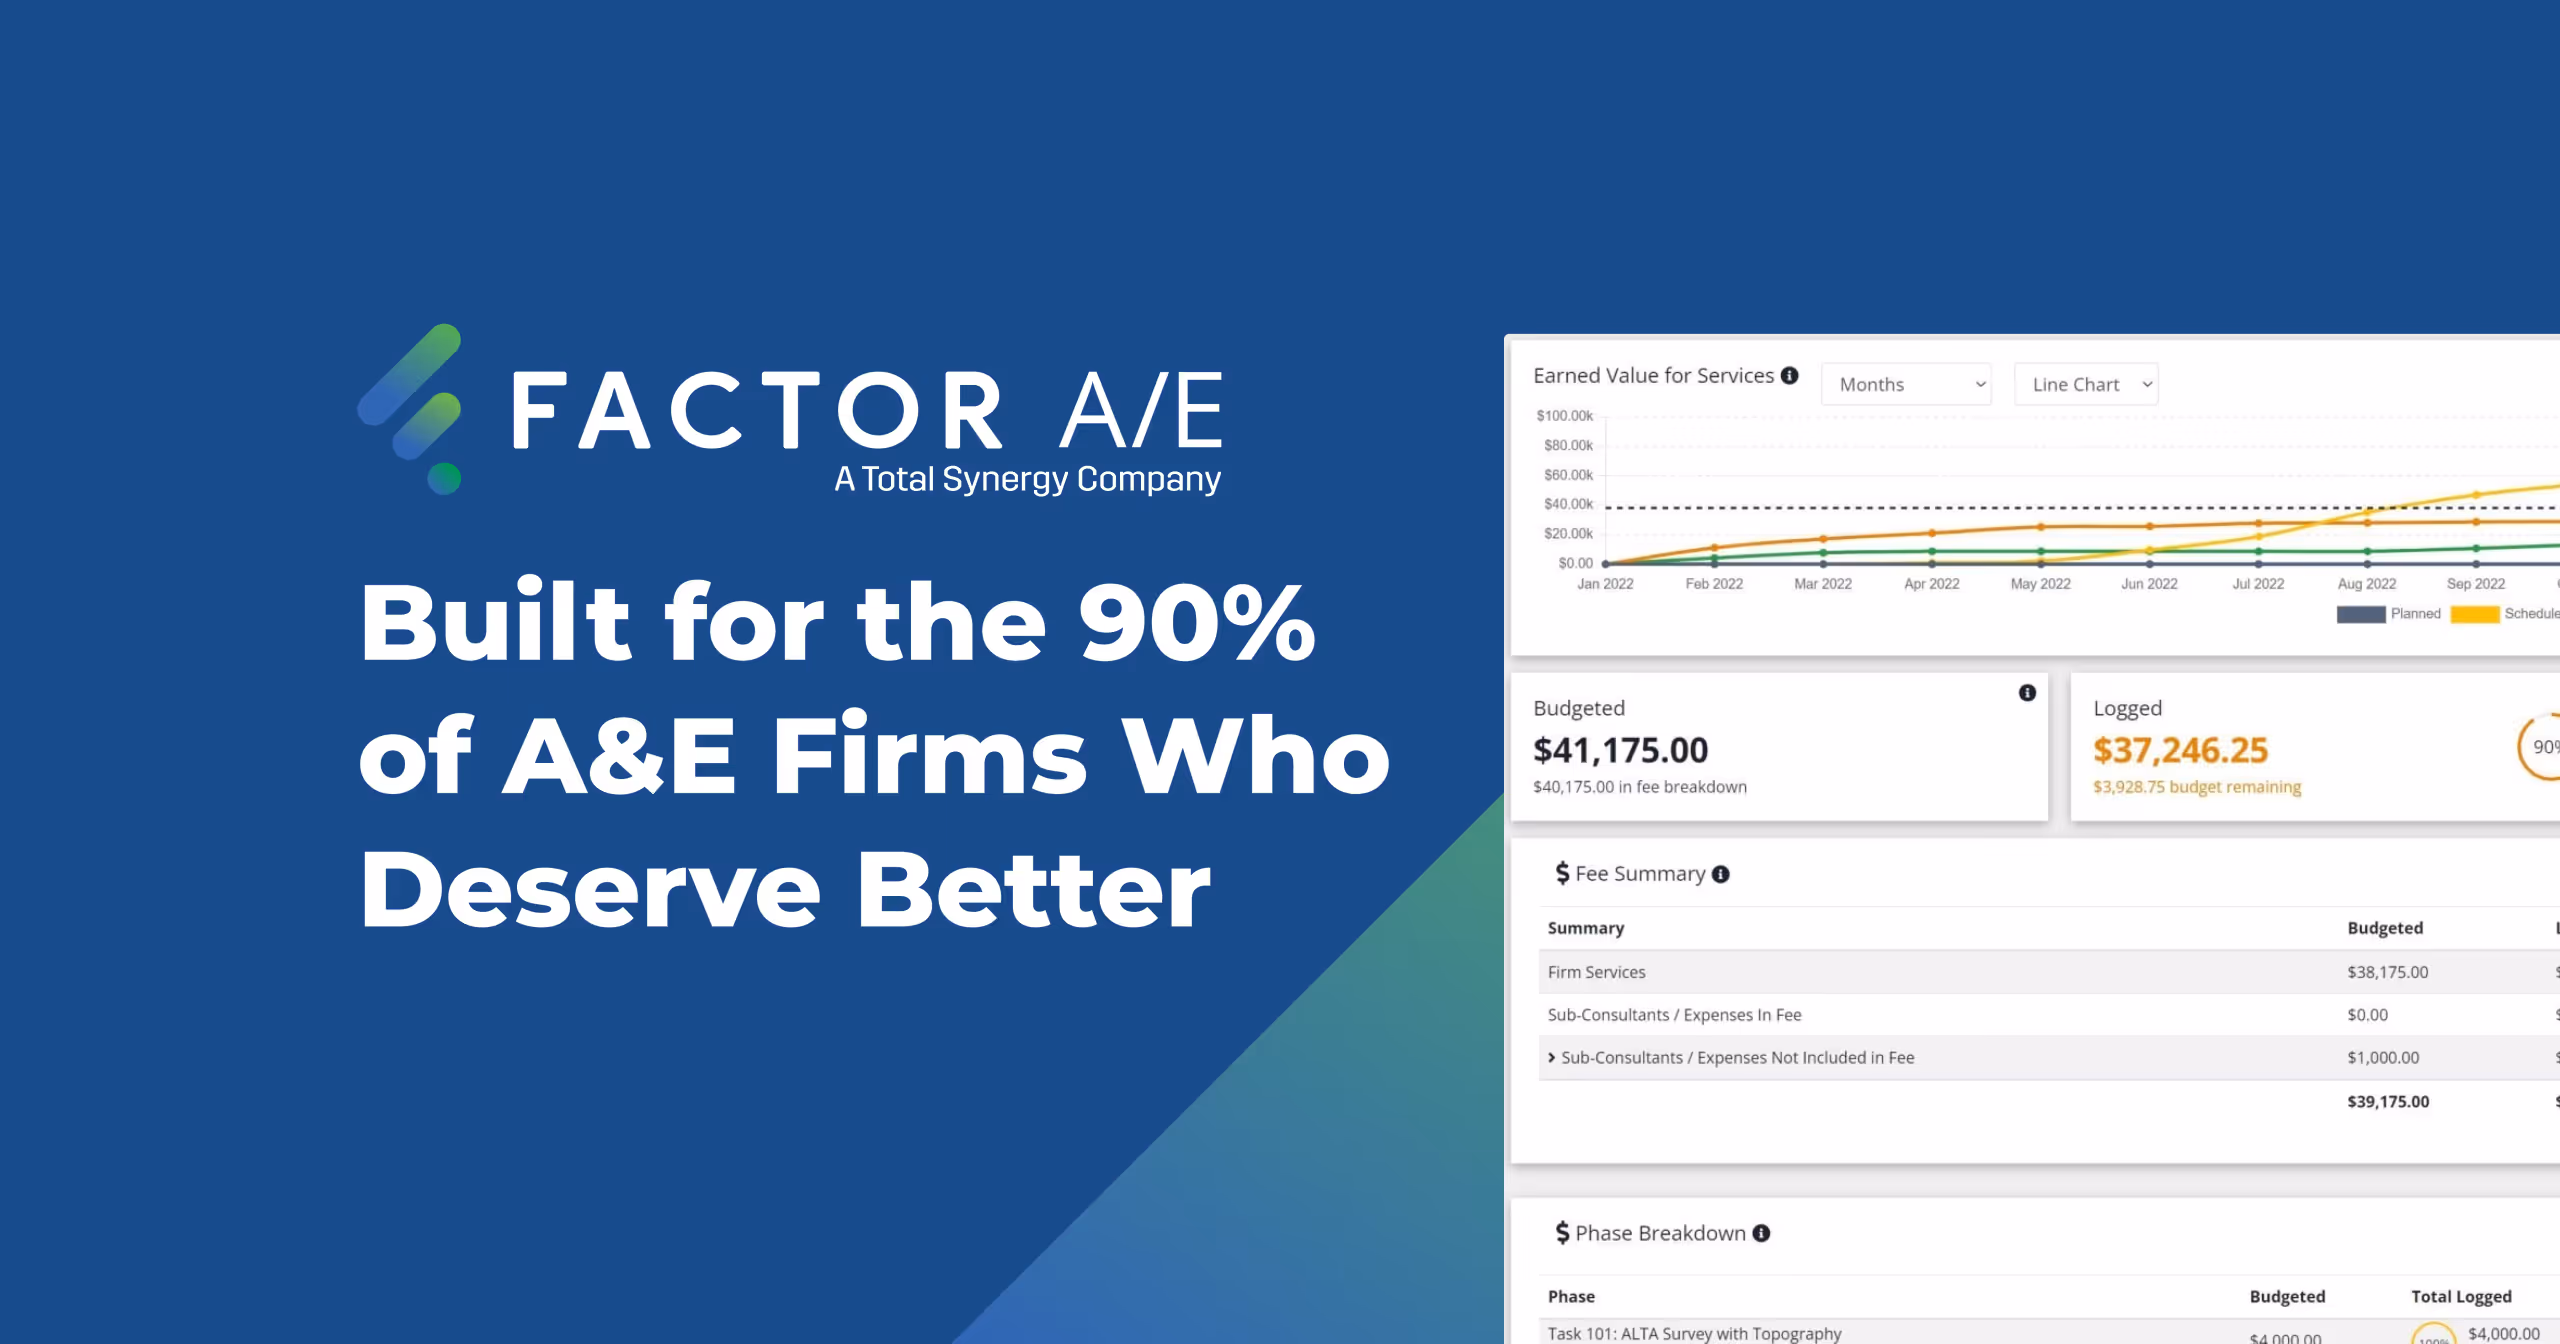
How Technology Enhances Financial Tracking
Tracking these metrics manually can be time-consuming and prone to error. Tools like Factor AE simplify the process by offering real-time dashboards, customizable reports, and automated calculations.
Key Benefits:
- Gain instant insights into financial performance.
- Improve accuracy in invoicing and expense tracking.
- Enhance decision-making with detailed, actionable data.
By automating financial tracking, your firm can reduce errors, save time, and focus on strategic planning to achieve business growth.
Conclusion
Financial metrics are the backbone of successful A/E firms. By focusing on utilization rates, overhead costs, break-even analysis, and other key indicators, firms can identify inefficiencies, optimize processes, and boost profitability.
The right tools, such as Factor AE, streamline tracking and reporting, ensuring your firm has the insights needed to thrive in a competitive landscape.

Recommended articles

See Factor in action
In one quick call, we’ll show you a simpler way to run projects and get paid faster.
.png)
“I recommend Factor to other firms. The team is great, it’s easy to use, and it has streamlined my project management. It can do the same for yours.”
Adam Mayberry
Architect / Managing Principal